
Comparison Grids to Help Decision Making
One of life’s joys and pains is making choices between options. Talking with someone recently, it occurred to me that some instructors may not be familiar with comparison grids that can make this type of decision making easier, so here are some basics… (These are sometimes referred to as Kepner-Tregoe decision matrixes).
A simple comparison of features might look like this:
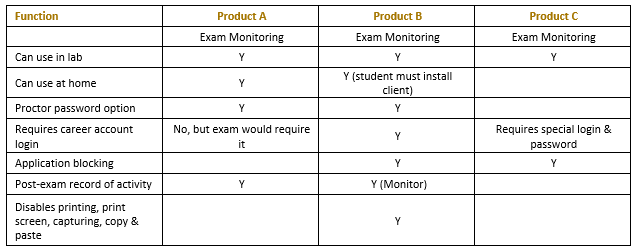
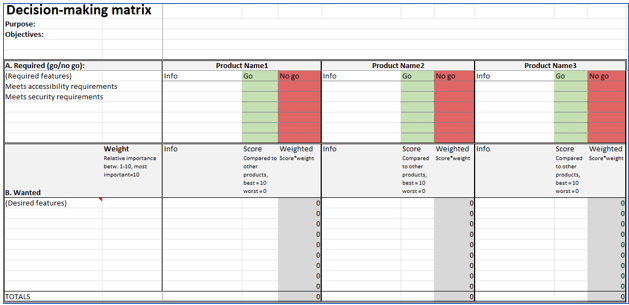
This works if all the features are equally important to you, but if some features are must-haves, some are very important, and others are nice-to-have, the above grid doesn’t really help. Instead, you can use a split grid with must-have features at the top and then weight the other features. Using this method, you can compare options more objectively.
The following procedure looks long, but a lot of it is just how to complete the grid. Your support team may also be very helpful in demonstrating tools and discussing options.
Basically, you are going to, as objectively as possible, compare the product features. I have used these types of grids in a wide variety of circumstances such as making a decision on my own and also working with a team to identify which technology my institution should purchase. The procedure below mentions technology, but the grid can be used when buying a house, determining which car to buy, etc.
Procedure:
- Write out what your purpose and objectives are for using this type of technology. Add these to the top of your grid.
- Ask your support team (educational technologist and/or instructional designer) what tools/technologies are available.
- Identify what other tools/technologies are available and do a cursory review of all the identified technologies. List the technologies across the top (row 6 in the sample grid).
- Create a list of all the features you can think of that this type of technology might offer. Do not limit yourself to the features of a particular solution.
- Identify which features are ‘must-haves’ – features that are required, such as “Meets accessibility requirements” or “Supported by IT.”
- Write these in the top section of the grid in Column A.
- Write the remaining features in the lower part of the grid in Column A.
- Reviewing all of the remaining features, rank them and give each a rank between 1 and 10 with 10 as most important and 1 as least important. (You may have multiple features with the same ranking.) Note the ranking in Column B.
- Review each product or the Go/No-Go features and make notes in the top part of the grid if needed.
- Review each product for each of the other features, giving a comparative score to each, using 0 to indicate the feature is missing in the product and 10 to indicate it is the best product for this particular feature. As you review products, you might find you add features. Be sure to weight them as you go along.
- Multiply the product’s score by the feature’s weight to get a comparative score then add up the product scores to see a relatively objective total comparison of products.
The empty grid (Excel .xls file) can be download and modified to meet your needs. For very complex decisions, you may want to complete a detailed page for each and complete a risk analysis for each.
Once you have made your decision, learn and practice installing, opening, and using the product (preferably multiple times over a week or two with scaffolded support). Work with your support team to write up syllabus guidelines for student use.